10 Essential Lead Generation Metrics to Measure Success

Lead generation is the third most important metric when measuring the effectiveness of marketing strategies. It’s no surprise; after all, without a steady stream of high-quality leads, your marketing efforts are essentially a shot in the dark. For B2B marketers, it’s not just about generating leads; it’s about generating the right leads, the ones that are ready to convert and become long-term customers.
But tracking leads isn’t as simple as counting how many people filled out a form. To get real results, you need to measure key performance indicators (KPIs) that offer insights into the quality and value of the leads you're generating. After all, what’s the point of getting a flood of leads if they aren’t the right fit for your product?
In this blog, we’re about to discuss 10 essential lead generation metrics you should be measuring to know whether your strategy is truly driving business growth. From attribution and conversion rates to customer acquisition costs, we’ll walk you through the metrics that matter most to your B2B success.
What Are Lead Generation Metrics?
Before we jump into the specifics, let’s define what we mean by lead generation metrics. A KPI (Key Performance Indicator) is a measurable value that shows how effectively you are achieving your business objectives. In lead generation, KPIs help track things like lead quality, conversion rates, customer acquisition costs, and more.
Why do these metrics matter? Because they give you real, actionable insights into your lead generation process. Without measuring them, you’re flying blind, trying to make decisions based on gut feelings rather than hard data.
Why Measuring Lead Generation Metrics Matters?
The simple truth is: Revenue is the lifeblood of any business. For B2B companies, generating high-quality leads is the first crucial step toward boosting sales and increasing MRR. But not all leads are created equal.
Here’s the thing: you need to track not just how many leads you’re getting, but also the quality of those leads.
Imagine this scenario: You’re generating a ton of leads, but when you look closer, most of them aren’t even interested in your product. They’re not in a position to buy, or worse, they don't even have the budget. This is where the magic of KPIs comes in. They help you determine the value of each lead, so you can focus on nurturing those who are most likely to convert into paying customers.
The B2B buyer’s journey can be long and complex. A lead might encounter several touchpoints across different channels before they decide to make a purchase. This makes it tough to pinpoint which interactions actually brought them to your doorstep. By measuring the right KPIs, you’ll gain clear insights into your lead generation performance and know exactly what to keep doing and what to cut out.
How to Choose the Right Lead Generation Metrics?
Lead generation campaigns generate a vast amount of data, like website visits, clicks, views, and impressions. It can be overwhelming to figure out what really matters. The key to choosing the right metrics is understanding that not all data is created equal. You need to focus on metrics that give you actionable insights aligned with your specific business goals and sales process.
Start by defining your core objectives. For example, if your goal is to generate high-value leads, you should focus on metrics that show lead quality, such as Lead Conversion Rate (LCR) or Customer Lifetime Value (CLV). These metrics will help you assess whether your leads are truly qualified and likely to bring long-term value to your business.
Next, align your metrics with your target audience. If you're running paid ads, for instance, the focus should be on metrics like Cost Per Lead (CPL) and Return on Ad Spend (ROAS) to evaluate the efficiency and profitability of your ad spend. These metrics tell you whether you're attracting the right kind of leads at the right cost.
Finally, align your metrics with your sales process. If your sales cycle is long, consider metrics like Time to Conversion to measure how quickly leads are moving through the pipeline. This can highlight potential inefficiencies in your nurturing process or gaps in follow-up strategies.
A good rule of thumb is to start with the big picture, then zoom in on specific KPIs that directly tie to your objectives.
The 10 Essential Lead Generation Metrics You Should Start Measuring
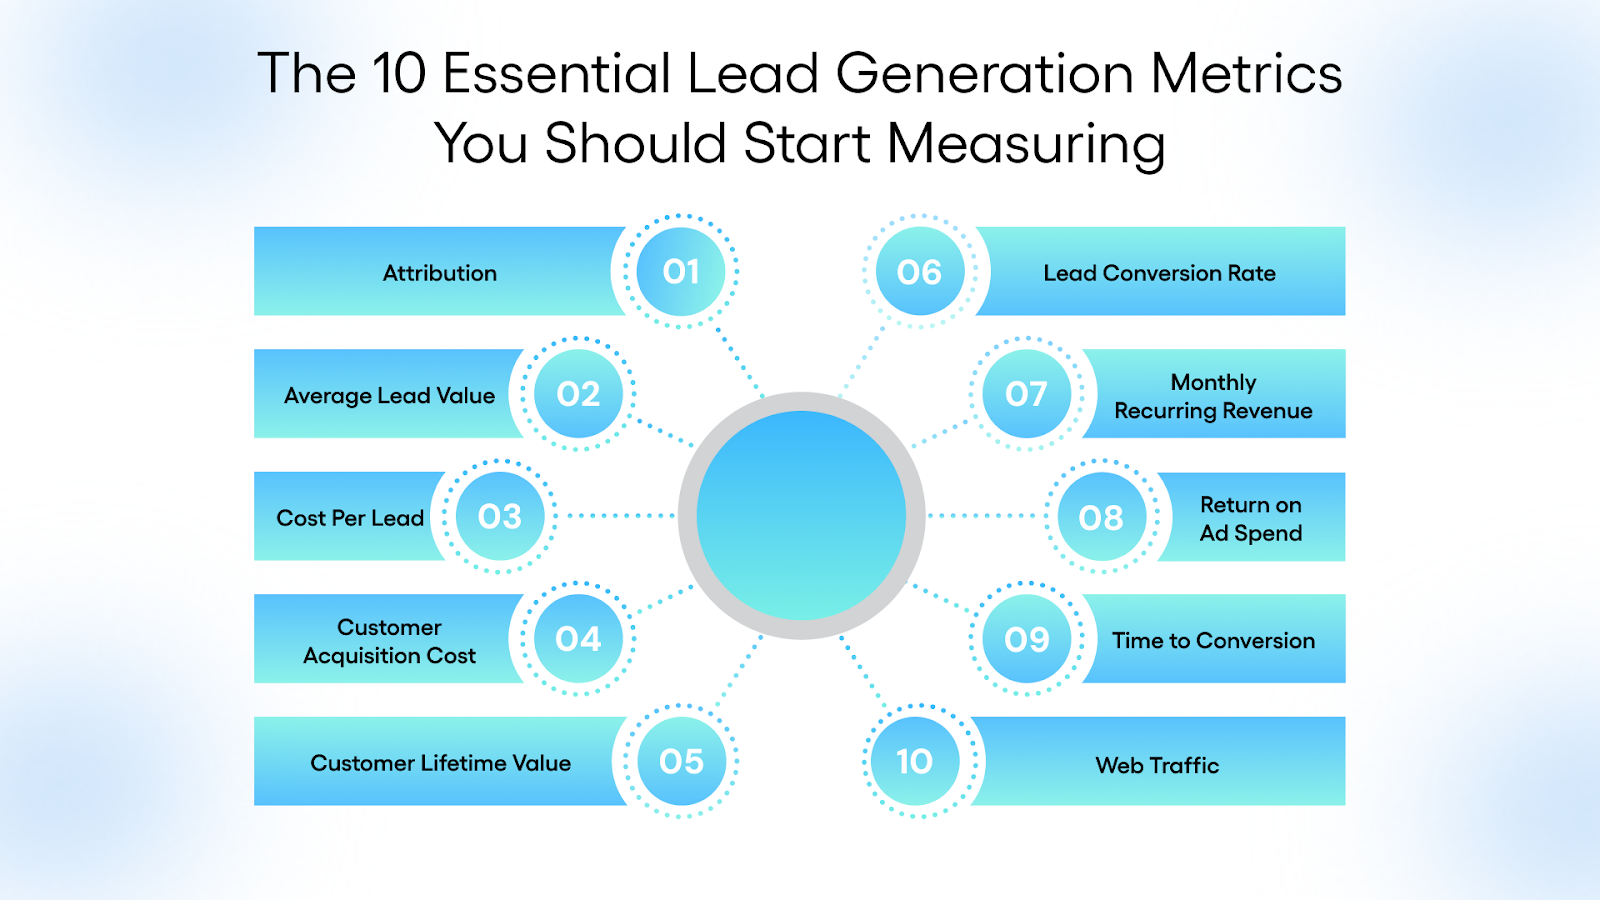
Let's get to the important part: the 10 essential lead generation metrics you should be tracking right now to measure success and optimize your campaigns:
1. Attribution
Attribution is all about understanding the journey your leads take before they convert. It connects the dots between your leads and their interactions across various channels. Knowing where leads first engaged with your brand and what interactions led them to convert. It helps you map out the buyer journey in detail.
Why it matters: Attribution helps identify your most compelling content, the channels that produce the highest-quality leads, and other insights that will help you refine your strategy. By tracking this, you can also personalize your content for leads who haven’t yet made a purchase, making sure you’re always speaking to their needs.
How to use it: To use attribution effectively, track every touchpoint in the buyer’s journey and determine which interactions lead to conversions. Focus on identifying which channels are driving the highest-quality leads and allocate more resources to those. Additionally, use attribution data to personalize your follow-up content based on where leads are in their journey, increasing engagement and encouraging conversions.
2. Average Lead Value (ALV)
Average Lead Value (ALV) is a vital metric that helps you understand the financial value of the leads you’re acquiring. This metric is calculated by dividing the total revenue generated over a specific period by the number of leads generated in that same period.
How to calculate it:
ALV = Total Sales Revenue / Total Number of Leads
For example, if your company generated $100,000 in sales and acquired 500 leads, your ALV would be:
ALV = $100,000 / 500 = $200 per lead
Why it matters: ALV not only shows how much revenue you can expect per lead, but it also helps you prioritize your efforts. With this metric, you can estimate the number of leads required to hit specific revenue goals. For instance, if your goal is $500,000 in revenue, and your ALV is $200, you’ll know you need 2,500 leads to achieve that target. ALV also helps in identifying which lead sources are producing the most valuable leads, so you can focus resources on high-performing channels.
How to use it: By regularly calculating ALV, you can adjust your marketing and sales strategies to prioritize higher-value leads. If you notice a particular lead source consistently yields high-value leads, you can allocate more resources to it to scale your efforts.
3. Cost Per Lead (CPL)
Cost Per Lead (CPL) is a key performance indicator that tells you how much you’re spending to acquire a single lead. It helps assess the efficiency of your lead generation campaigns, giving insight into whether your marketing spend is bringing in enough quality leads.
How to calculate it:
CPL = Total Campaign Cost / Number of Leads Acquired
For instance, if you spent $10,000 on a campaign and generated 400 leads, your CPL would be:
CPL = $10,000 / 400 = $25 per lead
Why it matters: CPL is essential for measuring the return on investment (ROI) for your lead generation campaigns. It helps you gauge whether your resources are being spent effectively. If the CPL is too high, it could signal that your campaigns need to be optimized. However, a low CPL isn't always better if the leads aren't qualified or don't convert, so balancing CPL with lead quality is crucial.
How to use it: Regularly monitor your CPL across various campaigns and channels. If you notice a high CPL, it could mean you're targeting the wrong audience or that your ad creatives and messaging need refining. By optimizing your CPL, you ensure you're acquiring quality leads without overspending.
4. Customer Acquisition Cost (CAC)
Customer Acquisition Cost (CAC) measures the total cost of acquiring a new customer, including all marketing and sales expenses. Unlike CPL, which focuses on lead generation, CAC looks at the entire process from lead to customer conversion.
How to calculate it:
CAC = Total Sales & Marketing Spend / Total Number of Customers Acquired
For example, if you spent $20,000 on marketing and sales activities and acquired 100 customers, your CAC would be:
CAC = $20,000 / 100 = $200 per customer
CAC is a comprehensive metric that helps you assess whether your customer acquisition efforts are financially sustainable. A low CAC means you're efficiently converting leads into paying customers, while a high CAC may indicate inefficiencies in your sales process. If your CAC is high, it could signal that you need to refine your targeting, improve your lead-nurturing process, or reduce sales friction.
How to use it: Compare your CAC to your Customer Lifetime Value (CLV) to determine whether you're spending appropriately to acquire new customers. If CAC is higher than CLV, it means you're spending more to acquire customers than you’ll earn from them in the long run, which is not sustainable. Monitor CAC closely and optimize your sales and marketing strategies to reduce it without sacrificing lead quality.
5. Customer Lifetime Value (CLV)
Customer Lifetime Value (CLV) estimates the total revenue a business can expect from a customer over the duration of their relationship. This is an essential metric for evaluating the long-term value of each lead and understanding how much to invest in acquiring and retaining customers.
How to calculate it:
CLV = (Average Value of Sale) × (Number of Repeat Transactions) × (Average Customer Lifespan)
Let’s say:
- The average value of each sale is $150.
- A customer makes 4 repeat purchases per year.
- The average customer stays for 3 years.
CLV = $150 × 4 × 3 = $1,800
CLV provides insight into the overall value of your customers and how much they’ll contribute to your revenue over time. A higher CLV allows you to justify spending more on lead acquisition and retention. If your CLV is too low compared to CAC, it may indicate that your customers aren’t staying long enough or generating enough revenue to justify acquisition costs.
How to use it: With a clear CLV, you can better allocate your marketing budget. For example, if you know that your CLV is $1,800, you can comfortably spend up to $500 or $600 per lead to acquire a customer and still be profitable. By understanding and improving CLV, you ensure long-term revenue growth and customer loyalty.
6. Lead Conversion Rate (LCR)
Lead Conversion Rate (LCR) is the percentage of leads that convert into customers, indicating how effective your marketing and sales teams are at moving prospects through the sales funnel.
How to calculate it:
LCR = (Number of Conversions) / (Total Number of Leads at Specific Stage)
For instance, if you have 200 leads and 40 of them convert into customers, your LCR would be:
LCR = 40 / 200 = 20%
Why it matters: LCR is a fundamental metric because it reflects how well your team is converting interest into actual sales. A high LCR means you're attracting the right type of leads and guiding them effectively through the sales process. A low conversion rate suggests that there may be issues with your lead qualification or follow-up strategies.
How to use it: If your LCR is low, take a close look at how you’re nurturing leads and whether they’re being handed off properly from marketing to sales. Improving LCR typically involves refining your lead scoring, nurturing content, and sales outreach strategies.
7. Monthly Recurring Revenue (MRR)
Monthly Recurring Revenue (MRR) measures the predictable revenue generated each month from subscription-based products or services.
How to calculate it:
MRR = Subscription Rate × Number of Active Customers
For example, if you have 200 active subscribers paying $50 per month, your MRR would be:
MRR = $50 × 200 = $10,000 per month
For subscription businesses, MRR is a crucial metric that provides a steady stream of revenue. It helps you forecast future income, track growth, and ensure that you're building a solid customer base. By focusing on increasing MRR, you can plan for growth and measure the effectiveness of subscription-related marketing campaigns.
How to use it: If you're running a subscription-based model, track MRR to ensure that your recurring revenue is growing over time. MRR also helps you assess customer retention; losing customers reduces MRR, while adding new customers increases it. Focus on strategies to reduce churn and increase customer lifetime value to boost your MRR.
How MRR and Smart Targeting with TLM Created a $20K Win
For example, one Pennsylvania-based managed service provider used MRR as more than just a metric; it became a roadmap for growth. By partnering with TLM to build precise, persona-driven outreach, they were able to target highly regulated industries, such as clinical research, and address very specific compliance and data security needs. The result?
A three‑year agreement worth $20,000 in MRR, a total contract value of $720,000. But it wasn’t just about the revenue number. With TLM’s data and campaign support, the MSP evolved from a generalist IT vendor into a trusted, strategic partner for life sciences firms, reducing their sales cycle by roughly 40% and setting the stage for long-term, higher-value engagements.
It’s a solid example of how focusing on MRR, combined with the right targeting tools, can drive more meaningful and profitable customer relationships.
8. Return on Ad Spend (ROAS)
Return on Ad Spend (ROAS) measures the revenue generated for every dollar spent on advertising. It’s a key metric for assessing the effectiveness of paid marketing campaigns.
How to calculate it:
ROAS = Revenue from Ads / Cost of Ads
For example, if you spent $2,000 on paid ads and generated $8,000 in revenue, your ROAS would be:
ROAS = $8,000 / $2,000 = 4
Which means you earned $4 for every $1 spent on advertising.
ROAS helps you understand how well your paid advertising campaigns are performing. A high ROAS means you're getting a solid return on your advertising investment.
Use ROAS to evaluate the success of each paid channel and campaign. If your ROAS is low, consider optimizing ad creatives, adjusting targeting, or testing different platforms to improve efficiency.
9. Time to Conversion
Time to Conversion measures how long it takes a lead to move from first contact (site visit, email interaction) to becoming a paying customer. Short times mean the funnel is doing its job, leads move quickly, and sales happen faster. Long times point to bottlenecks: slow follow‑ups, missing content, or misaligned sales and marketing.
Identify where leads stall. If delays occur in consideration, consider adding better educational content or improving handoffs between marketing and sales. Speeding this up shortens sales cycles and improves revenue velocity.
10. Web Traffic
Web traffic measures the number of people visiting your site. It’s a basic but vital indicator of how well your marketing efforts are attracting potential leads. High‑quality, targeted traffic means your campaigns are reaching the right audience, a critical first step in turning visitors into customers. Even if traffic doesn’t immediately convert, it gives you a foundation to build relationships and nurture future sales.
Focus on both quantity and quality. Use tools like Google Analytics to review where your traffic comes from, organic search, paid ads, social media, and how visitors behave once on your site.
- Are they engaged?
- Do they stay long enough?
- Do they explore your pages?
If traffic is high but engagement is low, your site or campaign may be misaligned with the audience. Use this data to adjust targeting, refine site content, and attract leads that are more likely to convert.
Boosting US Staffing's Client Base with TLM’s B2B Lead Generation
A franchise offering staffing solutions to local businesses was struggling to generate qualified leads. Despite heavy investments in digital marketing, the sales team was hindered by manual outreach, neglected follow-ups, and missed opportunities. As competition grew, the company needed a more targeted approach to connect with the right decision‑makers and stand out in a crowded market.
At TLM, we implemented a focused strategy:
- Added a dedicated team member for contact discovery and launched a four‑touch email campaign.
- Targeted industries like accounting, manufacturing, law firms, IT, and financial services, focusing on businesses with 5–100 employees.
- Used approachable, casual language and optimized deliverability by routing emails through our server.
The results came quickly. In the first month, the franchise began to see 2–3 qualified leads and received direct calls and LinkedIn requests from local businesses. By months two and three, lead generation increased to 6–7 leads per month, enabling the company to outperform its competitors and gain visibility in the staffing industry. The sales team also began making calls to warm and cold leads, sparking new conversations and opening doors for long‑term growth.
How can TLM Drive Your B2B Lead Generation?
At TLM Inside Sales, we specialize in email marketing services designed to streamline your B2B lead generation efforts, accelerate your sales pipeline, and deliver measurable results.
Our proven data-driven strategies and innovative email marketing tactics have made us a trusted partner for Managed Service Providers (MSPs) and other B2B businesses, with 94% of our clients in the MSP sector. We are proud to offer an ROI guarantee, backed by an 88% customer retention rate, ensuring that every campaign we run delivers results.
Here’s how TLM transforms your lead generation efforts:
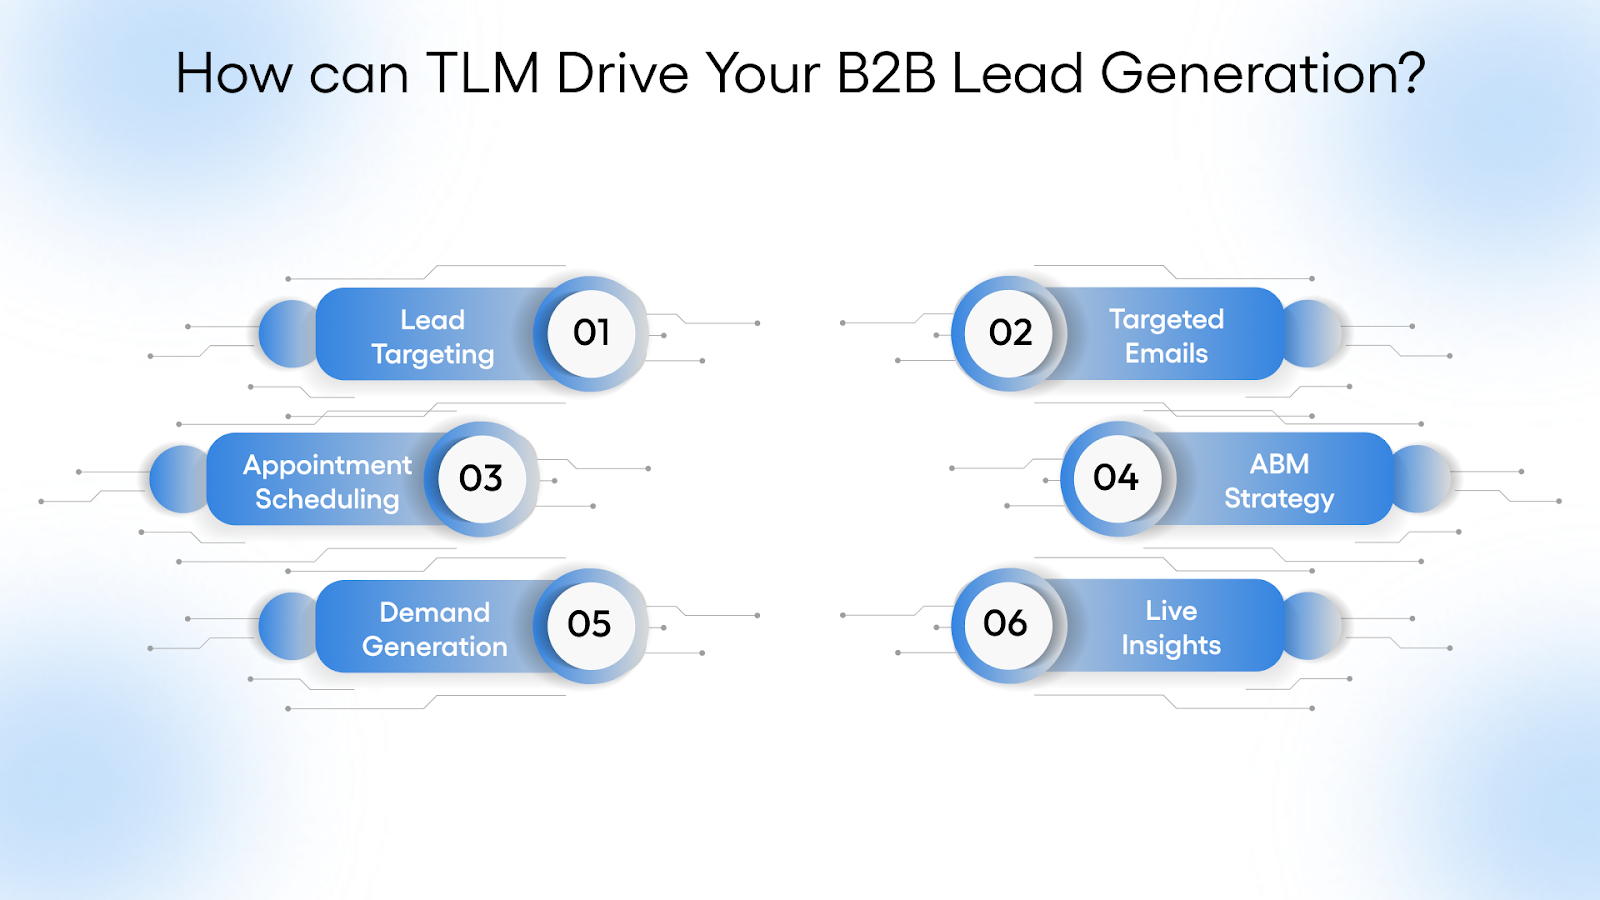
- Targeted Lead Generation: We craft precise, segmented email lists to ensure your messages reach the right prospects, increasing the chances of meaningful engagement and conversions.
- Personalized Email Campaigns: Generic emails fall flat. We design customized campaigns that resonate with each audience segment, making your outreach more relevant and impactful.
- Appointment Scheduling: We automate appointment scheduling, ensuring your sales team focuses on closing deals rather than chasing down leads, improving efficiency and productivity.
- Account-Based Marketing (ABM): For high-value accounts, we deploy personalized email strategies directly targeting decision-makers to accelerate the sales cycle and drive quicker conversions.
- Demand Generation: We engage and nurture prospects with multi-channel email marketing strategies, creating a steady stream of warm leads and building strong brand awareness.
- Real-Time Analytics & Optimization: With our data-driven approach, we track the performance of every campaign and continuously refine strategies, ensuring optimal outreach and better results with every email sent.
Tracking the right lead generation metrics isn’t just about gathering numbers; it’s about gaining actionable insights that drive smarter decisions and fuel growth.
At TLM, we specialize in helping businesses optimize their lead generation strategies. Our team can help you implement the right metrics, refine your sales processes, and ensure that your efforts are aligned with your business goals.